News
Loading
Loading
Loading
Loading
Loading
Loading
Loading
Loading
Loading
Loading
News
Loading
Loading
Loading
Loading
Loading
Loading
Loading
Loading
Loading
Loading
Premium Key Levels
Loading
Loading
Loading
Loading
Loading
Loading
Loading
Loading
Loading
Loading
Loading
Loading
Loading
Loading
Loading
Loading
Loading
Loading
Loading
Loading
Premium Journal
BTC/USDT7D RVWAPLong+2.14R
ETH/USDTW nPOCShort−1.62R
SOL/USDT30D RVWAPLong+2.48R
HYPE/USDTD nPOCShort−1.35R
BNB/USDTM VWAPLong+1.90R
AVAX/USDTW VWAPShort−1.18R
BTC/USDT7D RVWAPLong+2.14R
ETH/USDTW nPOCShort−1.62R
SOL/USDT30D RVWAPLong+2.48R
HYPE/USDTD nPOCShort−1.35R
BNB/USDTM VWAPLong+1.90R
AVAX/USDTW VWAPShort−1.18R
BTC/USDT7D RVWAPLong+2.14R
ETH/USDTW nPOCShort−1.62R
SOL/USDT30D RVWAPLong+2.48R
HYPE/USDTD nPOCShort−1.35R
BNB/USDTM VWAPLong+1.90R
AVAX/USDTW VWAPShort−1.18R
BTC/USDT7D RVWAPLong+2.14R
ETH/USDTW nPOCShort−1.62R
SOL/USDT30D RVWAPLong+2.48R
HYPE/USDTD nPOCShort−1.35R
BNB/USDTM VWAPLong+1.90R
AVAX/USDTW VWAPShort−1.18R
BTC/USDT7D RVWAPLong+2.14R
ETH/USDTW nPOCShort−1.62R
SOL/USDT30D RVWAPLong+2.48R
HYPE/USDTD nPOCShort−1.35R
BNB/USDTM VWAPLong+1.90R
AVAX/USDTW VWAPShort−1.18R
BTC/USDT7D RVWAPLong+2.14R
ETH/USDTW nPOCShort−1.62R
SOL/USDT30D RVWAPLong+2.48R
HYPE/USDTD nPOCShort−1.35R
BNB/USDTM VWAPLong+1.90R
AVAX/USDTW VWAPShort−1.18R
BTC/USDT7D RVWAPLong+2.14R
ETH/USDTW nPOCShort−1.62R
SOL/USDT30D RVWAPLong+2.48R
HYPE/USDTD nPOCShort−1.35R
BNB/USDTM VWAPLong+1.90R
AVAX/USDTW VWAPShort−1.18R
BTC/USDT7D RVWAPLong+2.14R
ETH/USDTW nPOCShort−1.62R
SOL/USDT30D RVWAPLong+2.48R
HYPE/USDTD nPOCShort−1.35R
BNB/USDTM VWAPLong+1.90R
AVAX/USDTW VWAPShort−1.18R
BTC/USDT7D RVWAPLong+2.14R
ETH/USDTW nPOCShort−1.62R
SOL/USDT30D RVWAPLong+2.48R
HYPE/USDTD nPOCShort−1.35R
BNB/USDTM VWAPLong+1.90R
AVAX/USDTW VWAPShort−1.18R
BTC/USDT7D RVWAPLong+2.14R
ETH/USDTW nPOCShort−1.62R
SOL/USDT30D RVWAPLong+2.48R
HYPE/USDTD nPOCShort−1.35R
BNB/USDTM VWAPLong+1.90R
AVAX/USDTW VWAPShort−1.18R
 TraderZayn
Orderflow & Optionsflow Trader
BTC/USDT—ETH/USDT—BNB/USDT—XRP/USDT—SOL/USDT—TRX/USDT—DOGE/USDT—ADA/USDT—LINK/USDT—BCH/USDT—AVAX/USDT—TON/USDT—LTC/USDT—UNI/USDT—NEAR/USDT—XLM/USDT—HBAR/USDT—DOT/USDT—SUI/USDT—APT/USDT—
$BTC Market Analysis through Liquidity, Options Flow and Order Flow.
LiquidityPositioningExecution
@TraderZayn · no signals
Framework
I read the BTC Auction through Liquidity, Options Positioning and Executed Order flow. That market read informs my bias, whether I take a position, and how I execute the trade.
01
Key levels that matter. Map the Auction using Key Highs and Lows, Value Areas, VWAPs, Unfinished Auctions, Resting Order-Book liquidity and Liquidation clusters. These key levels help identify areas where price may react, test liquidity or continue the auction.
02
Read Gamma Exposure, Strike concentrations, Call and Put walls, Put/Call Ratios and 25Δ skew, implied volatility, VEX and Max pain across Relevant Expiries. Use these Metrics to assess Dealer exposure, Hedging sensitivity and options positioning. Options data provides positioning context, not a standalone directional signal.
03
Track resting Bids and Asks on the DOM, monitoring whether liquidity is stacked, pulled or replenished as price approaches key levels. If the Bids or Asks remain in place as price reaches the level, assess Aggressive buying and selling to verify whether the resting liquidity is being executed or absorbing incoming flow. Track delta and volume to gauge participation, cross-check default Net Positioning for changes in exposure, and use Footprint Bid × Ask to verify executed volume at the level. Align liquidations with the order flow to identify forced position unwinds, then assess Aggregate Spot delta to determine Spot participation and whether Spot supports the move or exposes underlying weakness.
04
Use the combined market read to establish your bias and decide whether to go Long, go Short or stay flat. The thesis remains conditional on confirmation, with a clear level or condition that invalidates it.
05
Enter only when price and order flow confirm the thesis. Define the Entry, Invalidation and Risk before taking Trades, then manage or exit the position as the flows change.
These References map auction structure, value and areas of resting or potential forced-flow liquidity. A level is an area of interest, not a trade signal.
Interpret options metrics collectively. Gamma Exposure and Walls are not guaranteed support or resistance. Put Skew reflects relative demand and pricing for downside protection, not a certain directional outcome. Distinguish modelled Exposure and Open-interest data from executed options transactions.
The objective is to determine whether Aggressive Flow produces price displacement, is absorbed by passive liquidity, or fails to sustain the move. No single Delta reading, Footprint Imbalance, Liquidation event or CVD divergence establishes direction on its own.
Positioning is the directional decision derived from the combined market read: long, short or flat, conditional on the thesis and its invalidation.
Execution is the implementation of that decision through Entry confirmation, defined risk, Position management and Exit criteria as price and order flow evolve.
Illustrative data — not a live market feed
Depth of Market
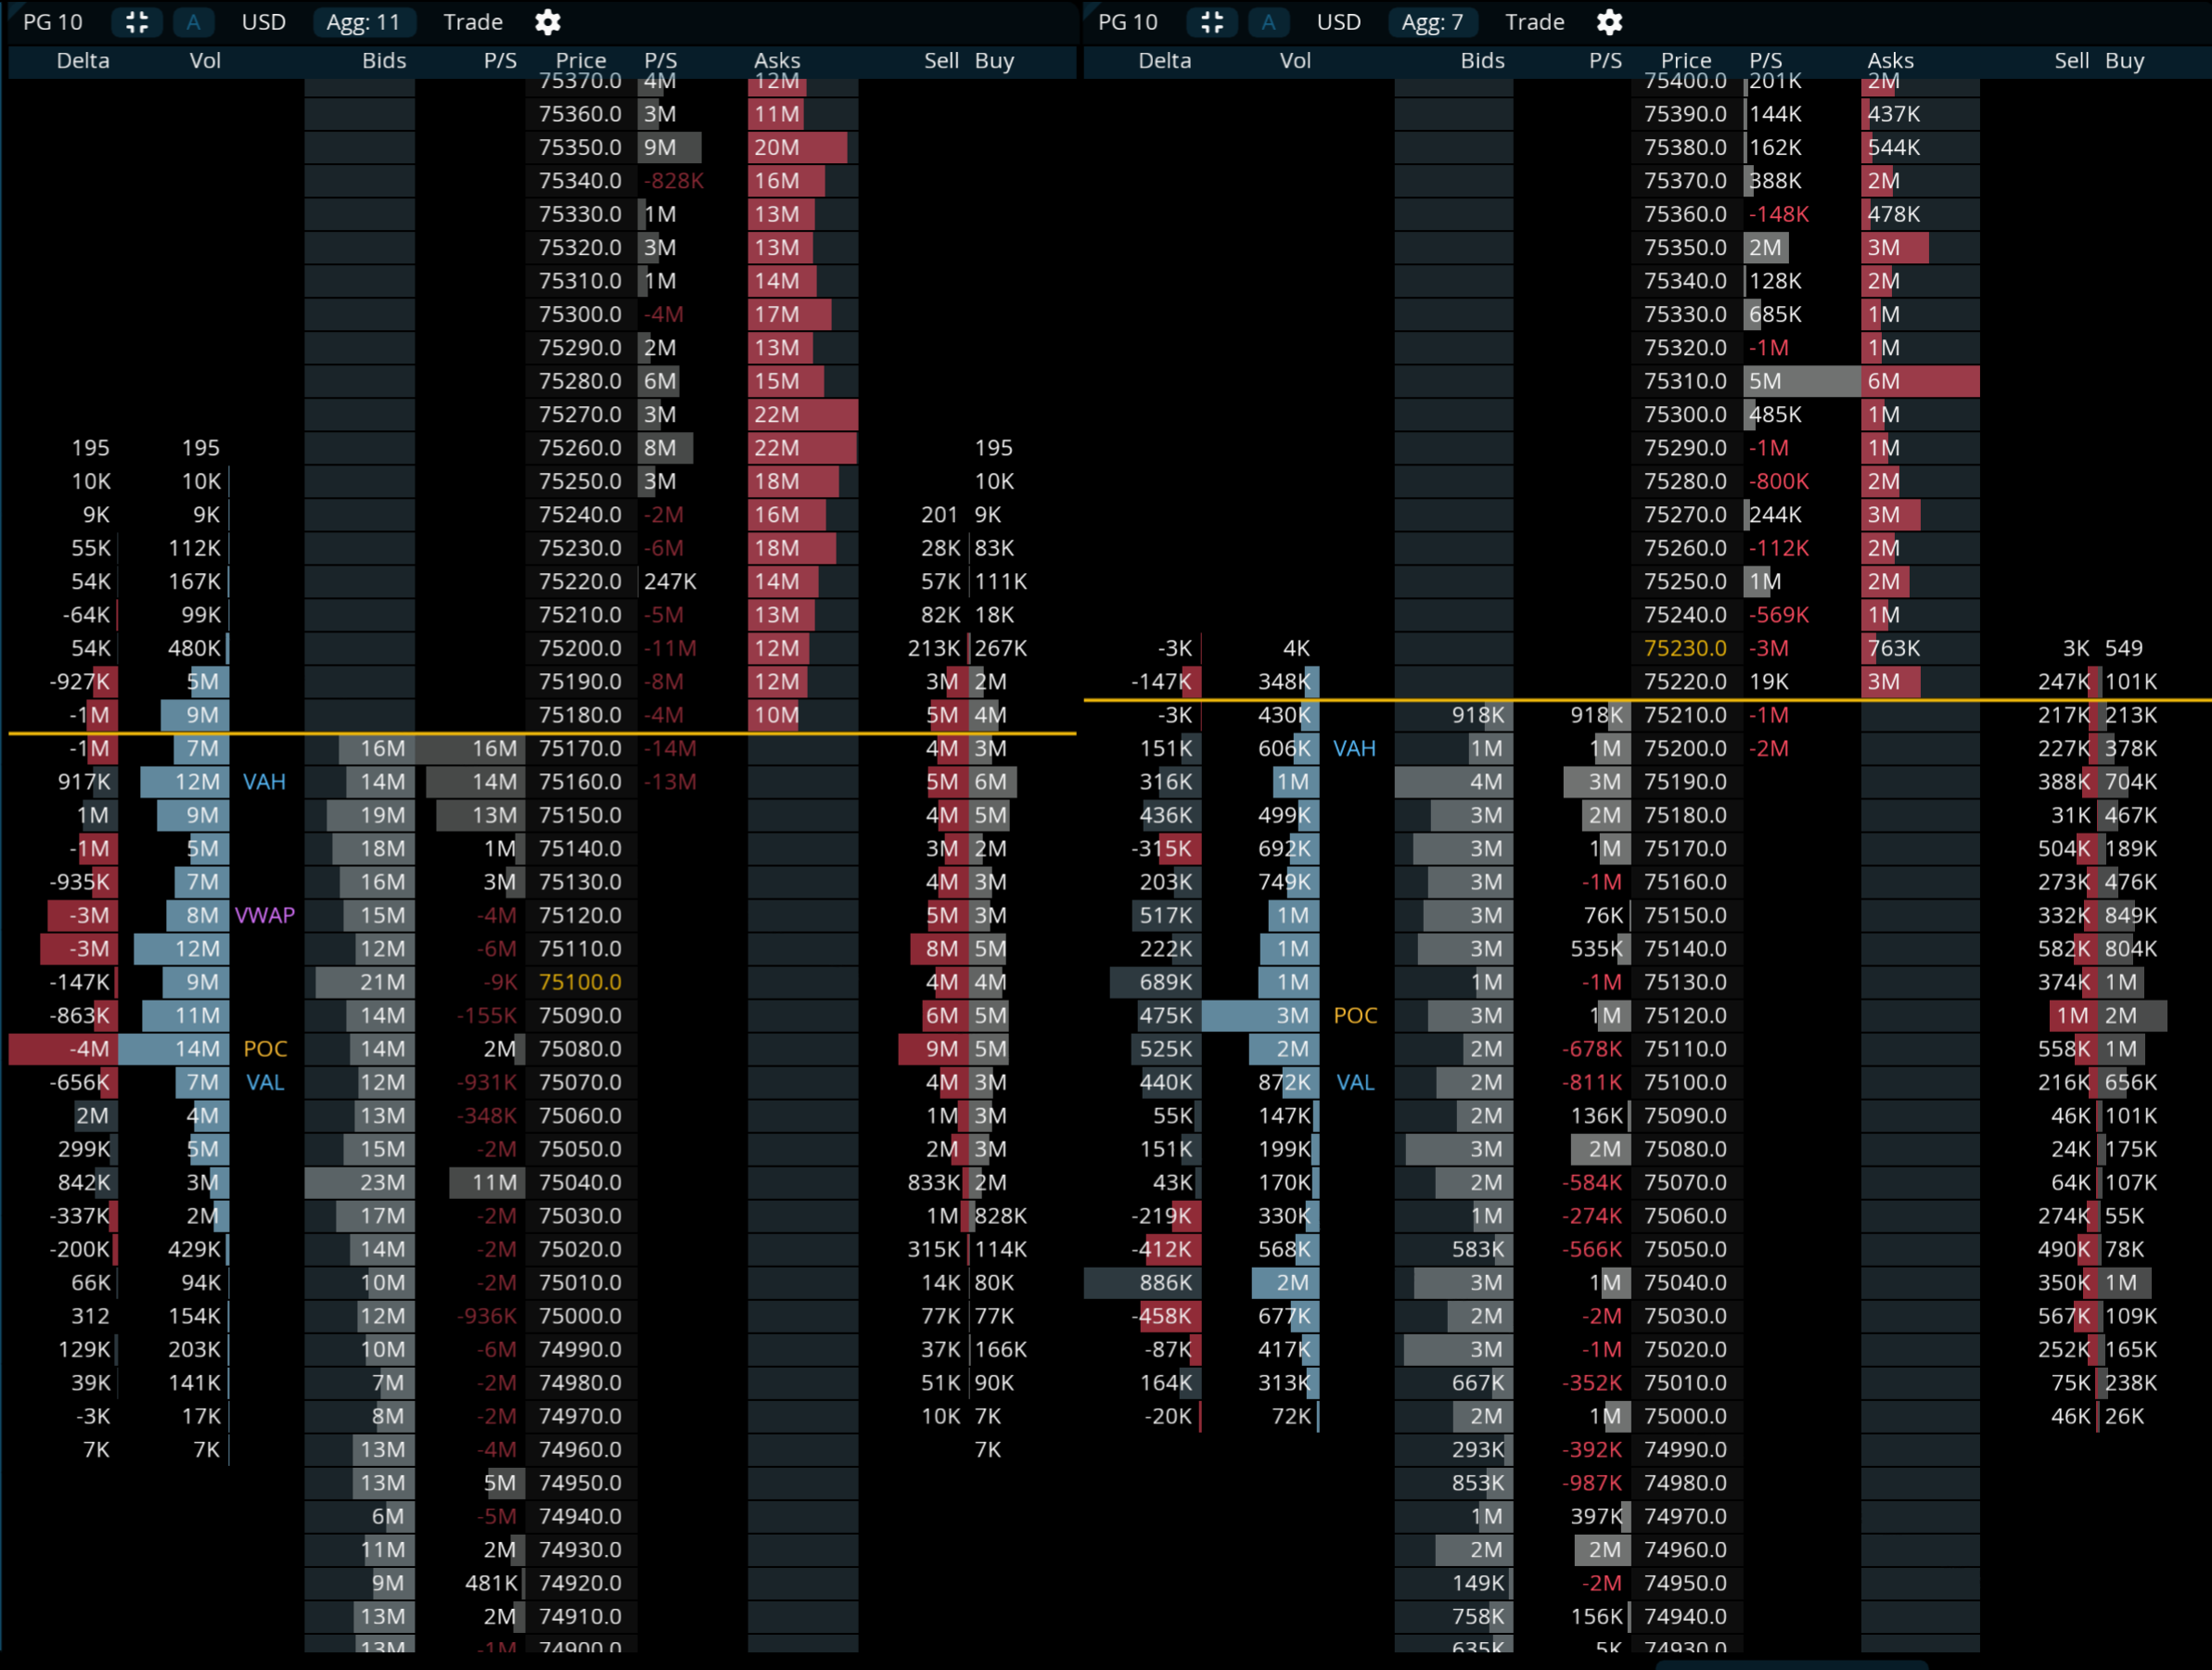
Not a live feed. Charts by MMT.
Notes
Desks
Gamma · same-day
Strike matrix beside 1H price, with a 30m stack locked to same-day positioning: options dashboard, gamma curve, and aggregated spot CVD.
Term structure
Same strike matrix on 1H, plus three dashboard panes so weekly, monthly, and the full book sit under price instead of one blended read.
Tape · DOM
30m auction chart linked to a split book: perp DOM and spot DOM, plus a $10k liquidation feed and a $10k print tape.
Resting liquidity
1m heatmap with pressure bands and the book profile, depth histograms at 5% and 10%, and a live order book beside the chart.
Spot vs options
Spot venues on the desk: pressure bands across Binance, Coinbase, Kraken, and OKX, depth at 2.5 / 5 / 10, then options flow and the Deribit/OKX heatmap.

